Release 1.2.1: HMI Charts
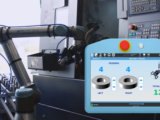
The new release of Robpod Studio is now available, introducing HMI charts – a new way to show real-time data on Universal Robots teach pendant.
HMI charts are UI components that together with buttons, inputs, labels, and others already available within the Robpod HMI Designer editor, allow to develop custom HMI panels in a drag and drop way, without the need to write long code scripts.
HMI charts can automatically acquire data from the robot and display it in real-time on the teach pendant, visualizing it in various types of charts: time series, histograms, pie charts, and indicators.
Why Charts?
There are several reasons to give a graphical representations of data directly on robot teach pendant:
☑️ The ability to monitor the robot’s status by displaying positions, speed, and forces can be a useful diagnostic tool for developers during the creation and testing of applications.
☑️ Monitoring torques and temperatures can be an excellent way to oversee the robot’s operational performance, enabling predictive maintenance activities when anomalies are detected in the data.
☑️ Charts can also be used to show process information, such as production quantities, cycle times, and production mix, giving operators and plant managers a clear idea of the ongoing process and potential optimizations.
Development and Customization
Robpod HMI Designer supports a full customization of HMI: developers can change style and colors of charts and all other graphical components. Additionally, it is not necessary to program the data collection and chart rendering operations—you can simply specify the names of the robot variables to be linked with the graphic components, and Robpod will handle the rest.
Next Steps
Check out Robpod Documentation to learn how to use your first HMI Chart.
If you haven’t done so yet, download and install Robpod Studio!


Ist das Anzeigen von sich verändernden Bildern auch möglich? Zum Beispiel bei einer Kamarainspektion, wenn immer wieder ein neuses Bild auf den selben Dateinamen gespeichert wird und das aktuellste immer im HMI angezeigt werden soll.
Hi Julia,
this is not yet possible, but we are working on a WebView component which allow to display dynamic webpages (which can inclue pictures) at runtime.
I will add this as a new feature request in any case, Thanks!